SKILLS REQUIRED
Matlab
LabView
Aerodynamics
Testing
Technical Writing
3D Printing
Data Acquisition
Data Visualization
SUMMARY: Performed Drag, Lift, and Pitching Moment tests in a wind tunnel on a Clark Y-14 airfoil


DESCRIPTION:
The objective of this project was to find, test, and recommend improvements for an early type of airfoil. The purpose of this task was to help new aerospace engineers work in a lab environment in order to test the aerodynamics of airplane wings, to acquire real-world data from a 3D printed scale-model, and to answer the question “Under what conditions will the airfoil stall and how will it stall?”
An “airfoil” is the profile of the wing normalized across its span (i.e. the overall profile keeps its proportions even though the relative dimensions at each cross-section changes across its span). The airfoil is considered the “base” design of the wing because each cross-section of the wing is based on the airfoil’s shape. Additionally, taking the airfoil is a good approximation before accessories/add-ons are put on the wing.

Metal Test Airfoil
The operating principle of an airfoil is as follows: pressure from air touches the front of the airfoil. Through clever use of geometry and aerodynamics, Lift is created on an airfoil by having more pressure under the airfoil than over, with special characteristics and relationships between these two bodies of pressure that can be measured. The purpose of testing an airfoil in the wind tunnel is to find these special characteristics - with the most important ones called the “Lift Coefficient”, “Drag Coefficient”, and the “Moment Coefficient about the Aerodynamic Center”, which our group tracked against different configurations of the Clark Y-14 Airfoil. For reference, a Clark Y-14 Airfoil provides reasonable (but suboptimal) performance characteristics from a geometry point of view.
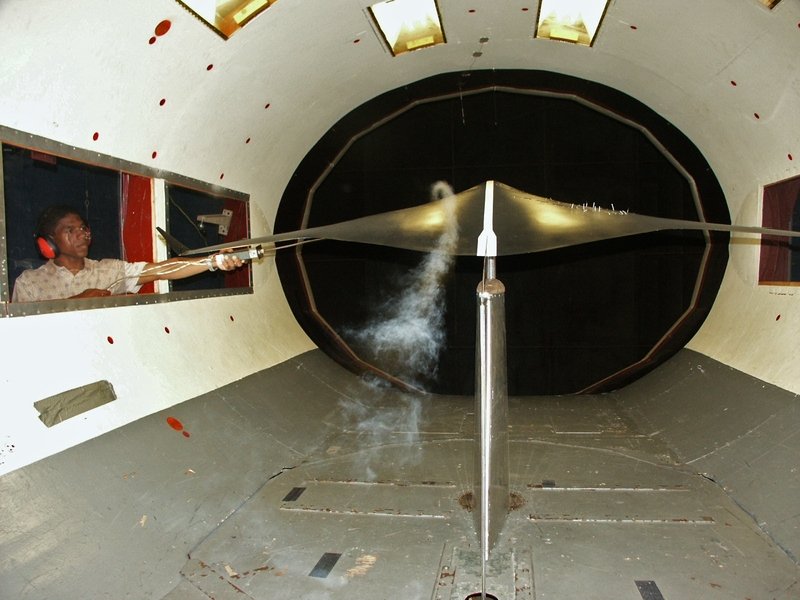
Inside a Wind Tunnel - source: https://news.mit.edu/
We put the different configurations in a wind tunnel, strapped to a “Sting Balance” (a weight/force scale), and connected the apparatus to a Data Acquisition device to provide real-time data on the forces the scale was detecting. The real-time (but unintelligible) readings were converted into meaningful data using a program called “LabView”. From there, we compared our experimental data produced from the wind tunnel against our theoretical models to figure out which configurations performed the best.
For more details, please view the file provided.
RESULTS